Scientific Programming
with the SciPy Stack
Shaun Walbridge
Kevin Butler
Scientific Computing
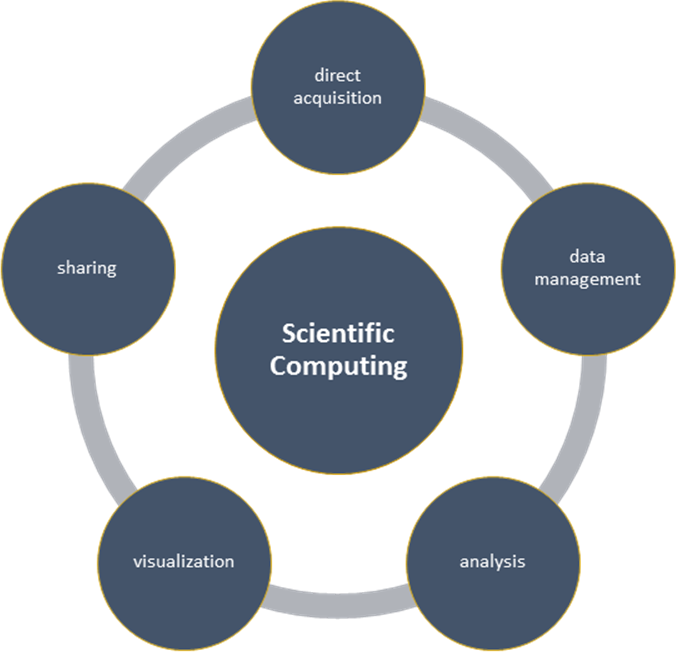
The application of computational methods to all aspects of the process of scientific investigation – data acquisition, data management, analysis, visualization, and sharing of methods and results.
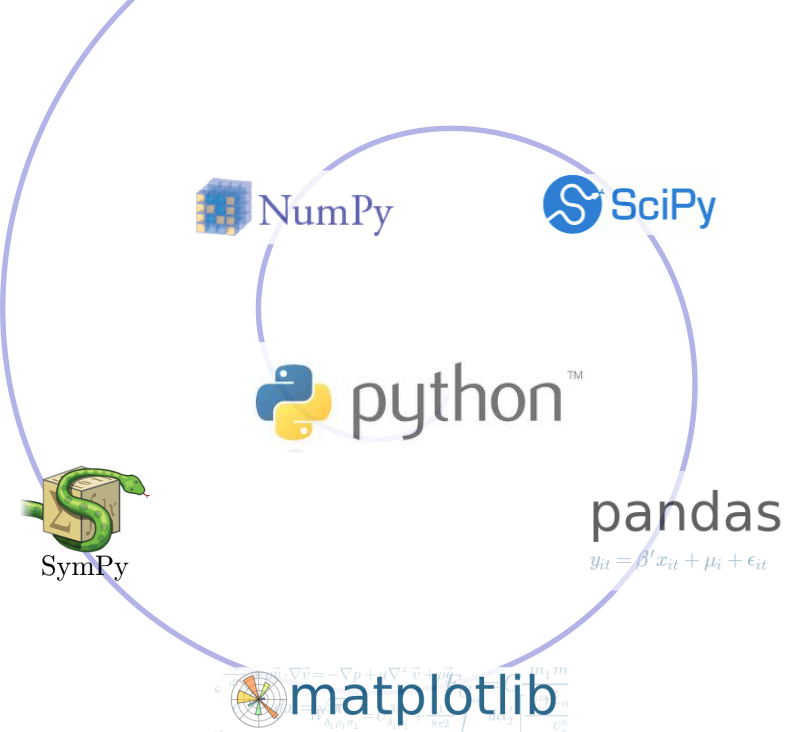
SciPy Stack
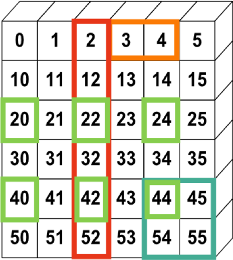
- An array object of arbitrary homogeneous items
- Fast mathematical operations over arrays
- Random Number Generation
SciPy Lectures, CC-BY
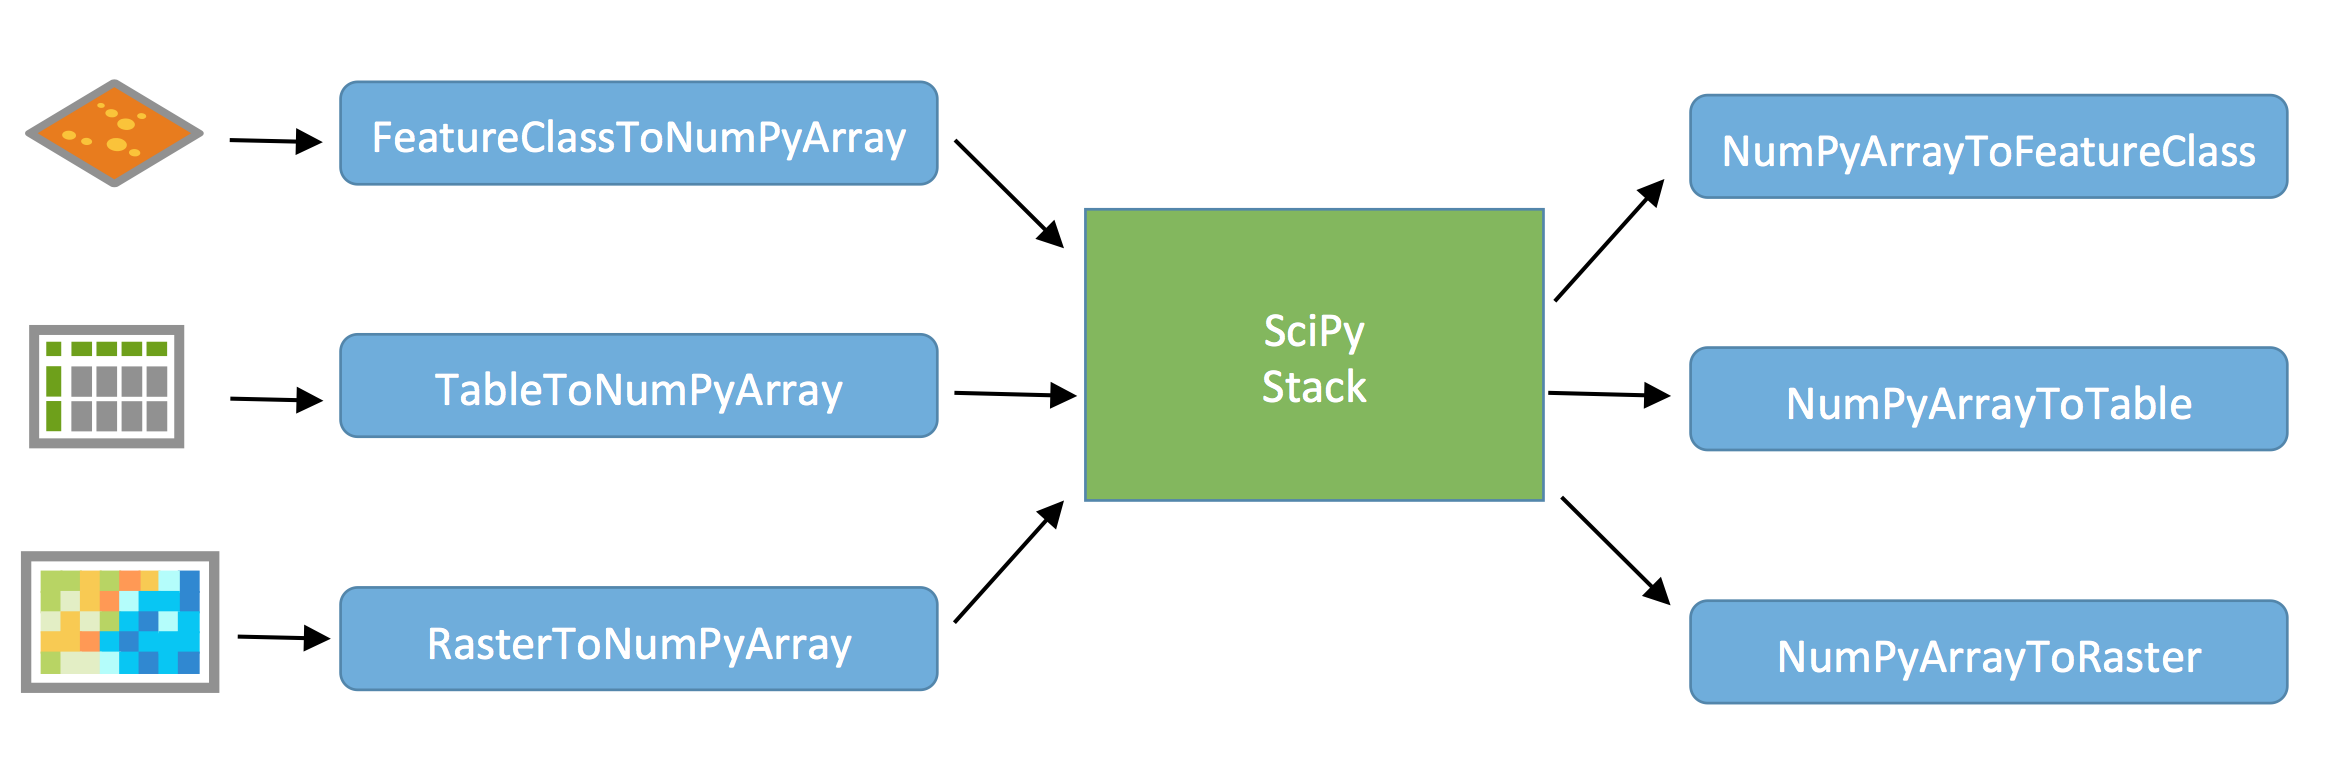
ArcGIS + NumPy
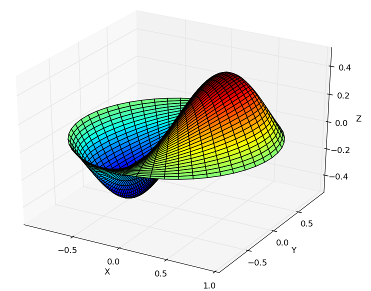
- Plotting library and API for NumPy data
- Matplotlib Gallery

Computational methods for:
- Integration (scipy.integrate)
- Optimization (scipy.optimize)
- Interpolation (scipy.interpolate)
- Fourier Transforms (scipy.fftpack)
- Signal Processing (scipy.signal)
- Linear Algebra (scipy.linalg)
- Spatial (scipy.spatial)
- Statistics (scipy.stats)
- Multidimensional image processing (scipy.ndimage)
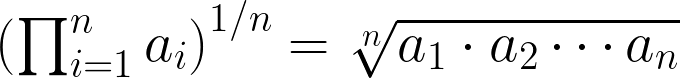
SciPy: Geometric Mean
- Calculating a geometric mean of an entire raster using SciPy (source)
import scipy.stats
rast_in = 'data/input_raster.tif'
rast_as_numpy_array = arcpy.RasterToNumPyArray(rast_in)
raster_geometric_mean = scipy.stats.stats.gmean(
rast_as_numpy_array, axis=None) SciPy Statistics
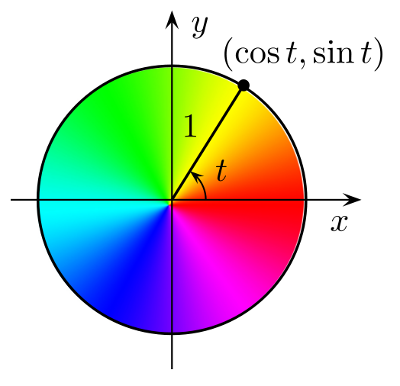
- Break down aspect into
sin()andcos()variables - Aspect is a circular variable — without this 0 and 360 are opposites instead of being the same value
- Panel Data — like R "data frames"
- Bring a robust data analysis workflow to Python
- Data frames are fundamental — treat tabular (and multi-dimensional) data as a labeled, indexed series of observations.
(Source)
import pandas

data = pandas.read_csv('data/season-ratings.csv')
data.columnsIndex([u'season', u'households', u'rank', u'tv_households', \
u'net_indep', u'primetime_pct'], dtype='object')majority_simpsons = data[data.primetime_pct > 50] season households tv_households net_indep primetime_pct
0 1 13.4m[41] 92.1 51.6 80.751174
1 2 12.2m[n2] 92.1 50.4 78.504673
2 3 12.0m[n3] 92.1 48.4 76.582278
3 4 12.1m[48] 93.1 46.2 72.755906
4 5 10.5m[n4] 93.1 46.5 72.093023
5 6 9.0m[50] 95.4 46.1 71.032357
6 7 8.0m[51] 95.9 46.6 70.713202
7 8 8.6m[52] 97.0 44.2 67.584098
8 9 9.1m[53] 98.0 42.3 64.383562
9 10 7.9m[54] 99.4 39.9 60.916031
10 11 8.2m[55] 100.8 38.1 57.466063
11 12 14.7m[56] 102.2 36.8 53.958944
12 13 12.4m[57] 105.5 35.0 51.094891
- A Computer Algebra System (CAS), solve math equations (source)
from sympy import *
x = symbol('x')
eq = Eq(x**3 + 2*x**2 + 4*x + 8, 0)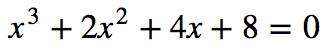
solve(eq, x)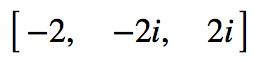
Rate This Session
iOS, Android: Feedback from within the app
Windows Phone, or no smartphone? Cuneiform tablets accepted.