Getting Data Science with R and ArcGIS
Shaun Walbridge
Mark Janikas
Marjean Pobuda
Data Science Languages
Languages commonly used in data science:
 R —
R — Python —
  Matlab —
  Julia
Julia
We're a big Python shop, so why R?
Why  ?
?
- Powerful core data structures and operations
- Data frames, functional programming
- Unparalleled breadth of statistical routines
- The de facto language of Statisticians
CRAN: 6400 packages for solving problems- Versatile and powerful plotting
- We assume basic proficiency programming
- See resources for a deeper dive into R
R Data Types
Vector:
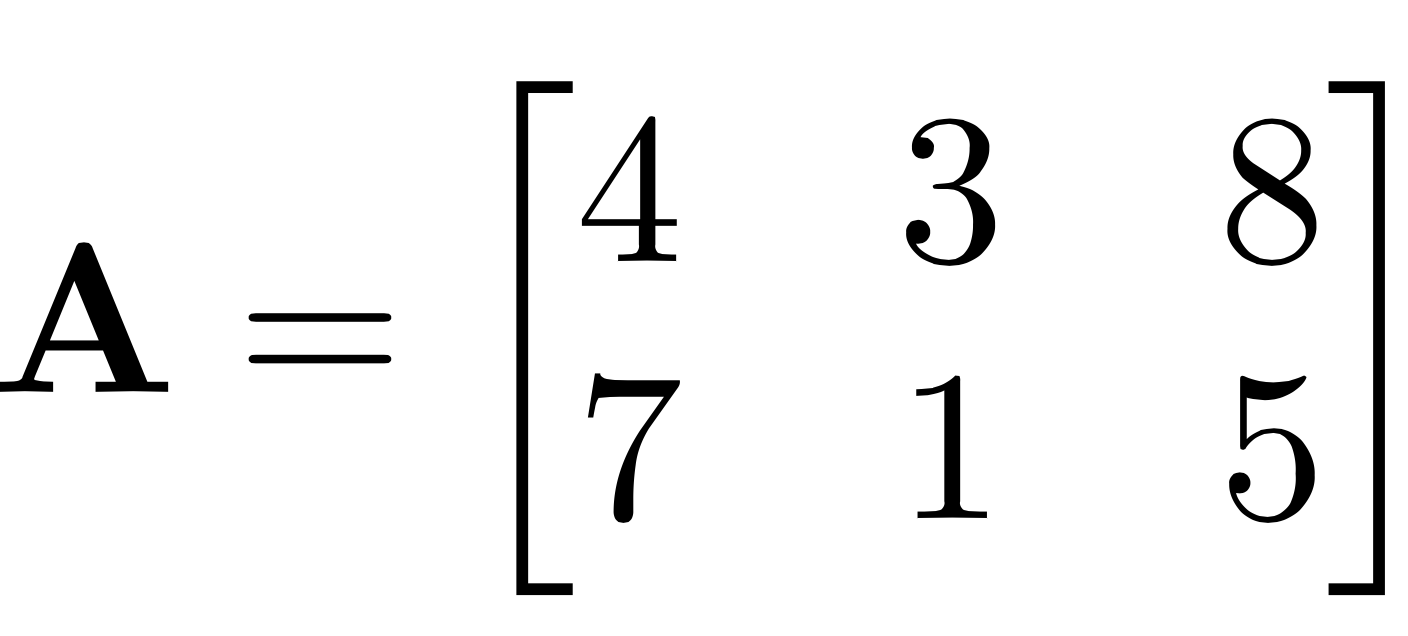
a.vector <- c(4, 3, 8, 7, 1, 5)Matrix:
A = matrix(
    c(4, 3, 8, 7, 1, 5), # same data as above
    nrow=2, ncol=3, # what's the shape of the data?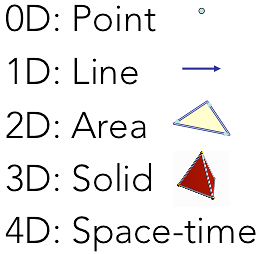
byrow=TRUE) # what order are the values in?sp Types
- 0D:
SpatialPoints - 1D:
SpatialLines - 2D:
SpatialPolygons - 3D: Solid
- 4D: Space-time
Entity + Attribute model
Hadley Stack
- Hadley Wickham
- Developer at R Studio, Professor at Rice University
ggplot2,scales,dplyr,devtools, many others
Development Environments

 née IPython
- R Tools for Visual Studio brand new
- Best of class tools for interacting with data.
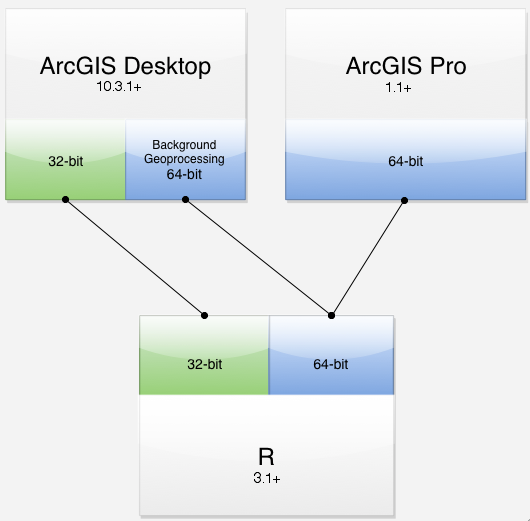
R — ArcGIS Bridge

- ArcGIS developers can create custom tools and toolboxes that integrate ArcGIS and R
- ArcGIS users can access R code through geoprocessing scripts
- R users can access organizations GIS' data, managed in traditional GIS ways
Building R Script Tools

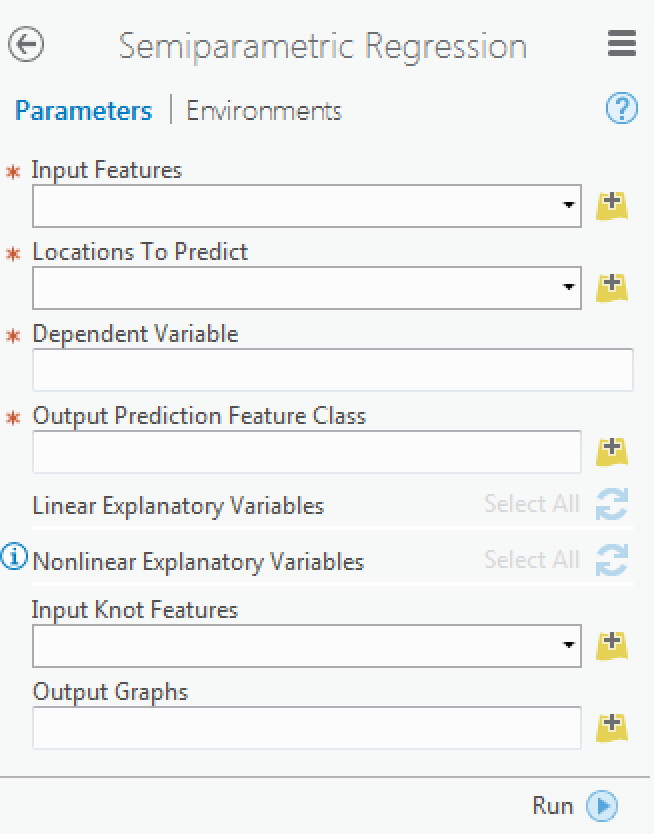
Building R Script tools
tool_exec <- function(in_params, out_params) {
  # the first input parameter, as a character vector
  input.features <- in_params[[1]]

  # alternatively, can access by the parameter name:
  input.input <- in_params$input_features
  print(input.dataset)
  # ... next, do analysis steps

  # this will be returned as the "Output Graphs" parameter.
  out_params[[1]] <- plot(results.dataset)
  return(out_params)
}Where Can I Run This?
Rate This Session
iOS, Android: Feedback from within the app
Windows Phone, or no smartphone? Cuneiform tablets accepted.