Spatial Data Science in ArcGIS: The Ecosystem
Data Science

The application of computational methods to all aspects of the process of scientific investigation – data acquisition, data management, analysis, visualization, and sharing of methods and results.

Plotting library and API for NumPy data
Pro also includes
arcpy.chartfor plotting via Pro chartsUC 2020: Embedded Pro charts in notebooks

- An array object of arbitrary homogeneous items
- Fast mathematical operations over arrays

SciPy Lectures, CC-BY
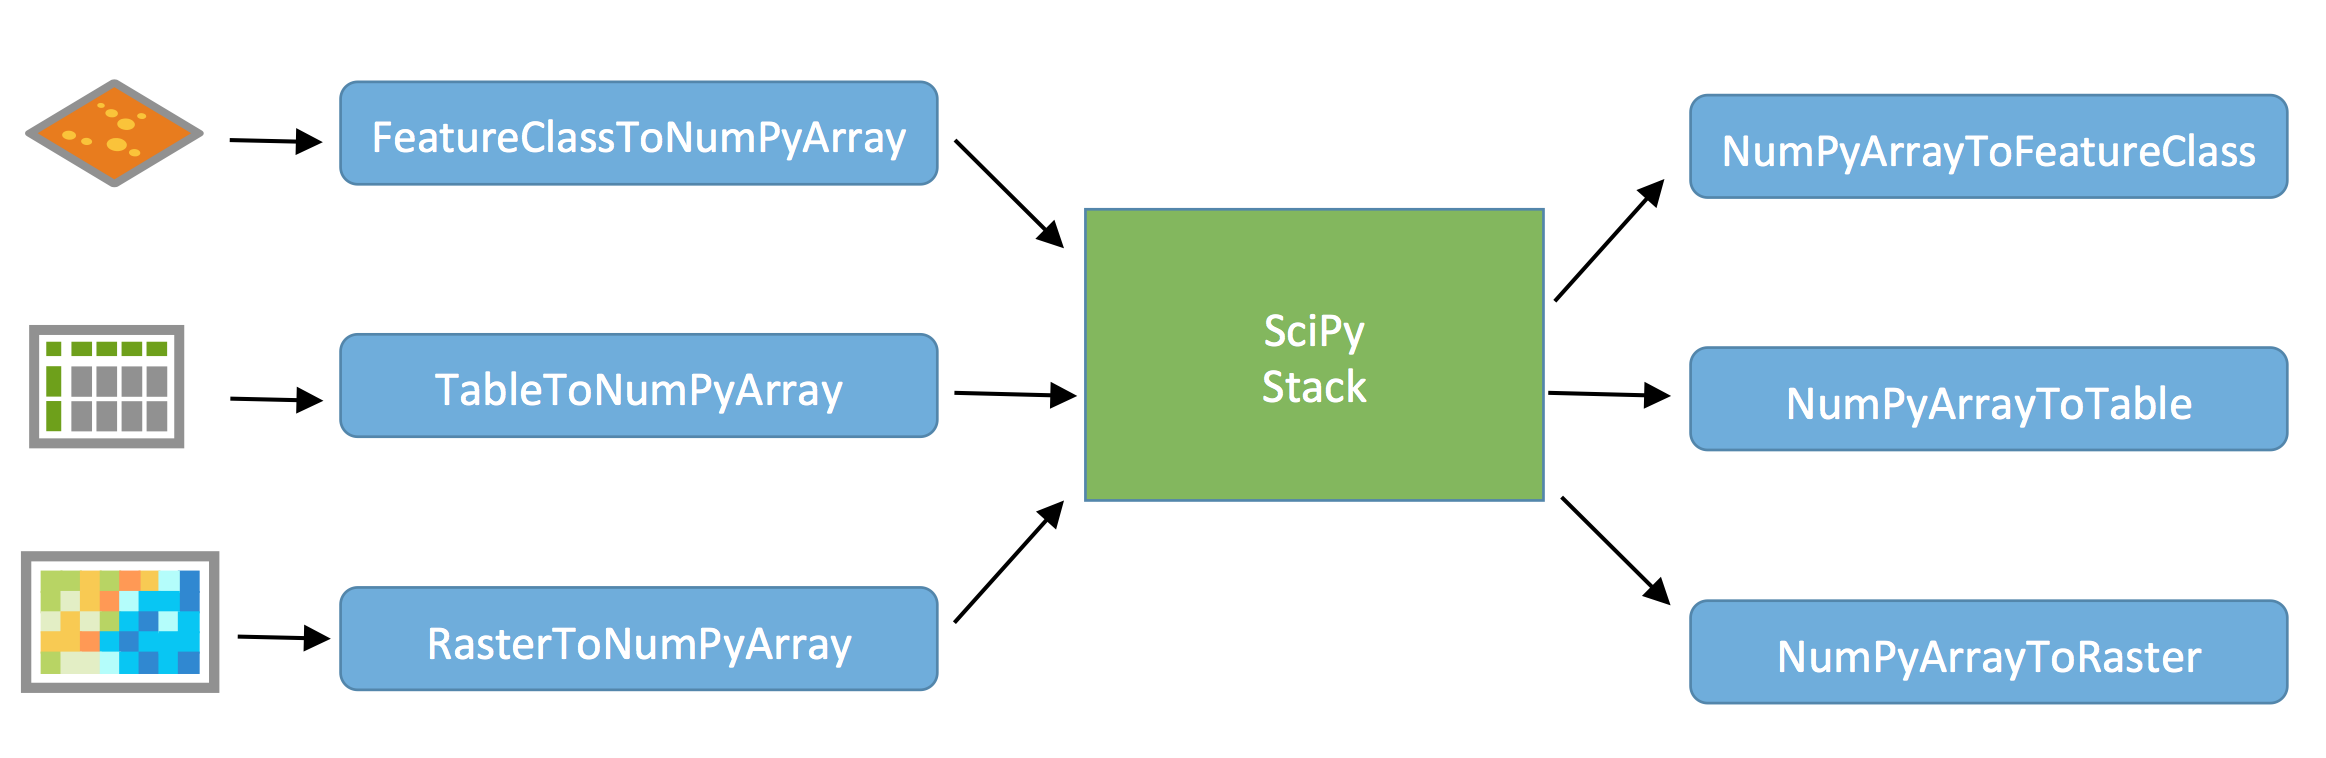
- ArcGIS and NumPy can interoperate on raster, table, and feature data.
- See Working with NumPy in ArcGIS
- In-memory data model. Example script to process by blocks if working with larger data.
- Use
arcgis’ SeDF if you need a high-level interface for feature data
ArcGIS with NumPy

Computational methods for:
- Integration (scipy.integrate)
- Optimization (scipy.optimize)
- Interpolation (scipy.interpolate)
- Fourier Transforms (scipy.fft)
- Signal Processing (scipy.signal)
- Linear Algebra (scipy.linalg)
- Spatial (scipy.spatial)
- Statistics (scipy.stats)
- Multidimensional image processing (scipy.ndimage)

- Panel Data — like R “data frames”
- Bring a robust data analysis workflow to Python
- Data frames are fundamental — treat tabular (and multi-dimensional) data as a labeled, indexed series of observations.
Integration
- What kind of code is being run?

- The Principle of stack minimization

- Massive data parallelism through Python
- Computes graphs of the computational structure
Pro External Environments
